

Instructor Profile
Name: Jim Mott
About Jim: Jim has 22 years of experience with SPSS, an IBM Company. From 1984 to 1998, he served as a technical writer, technical support specialist, and internal trainer. Jim has been a senior education consultant since 1998. He received a BA from Knox College and an MA and PhD from the University of Illinois at Chicago. In his spare time, Jim enjoys playing classical piano, attending the opera, playing golf, and hiking and camping.
Creating a single table with significance notation in IBM SPSS Custom Tables* 18
In IBM SPSS Custom Tables, you’ve always been able to perform statistical testing between variables in your table. These tests include a Chi-square test of independence, a comparison of column proportions test (z test) and a comparison of column means test (t test). However, in past versions of IBM SPSS Statistics**, whenever you performed either a z test or a t test, the significance test results were automatically displayed in a table separate from the actual table. This made the results somewhat difficult to read because you had to look at two tables instead of one. And while it was possible to combine the two tables into one with either a Visual Basic script or a Python script, the end result wasn’t in the format that many of you preferred.
With Statistics 18, you can choose now between creating two separate tables or creating a single table in an APA-publication-style format, which is commonly used for research publishing and reporting.
In the example below, you’ll perform a z test to compare whether the proportions of people who said they would stop riding public transit if the fare increased by 20 percent differed significantly from the proportion of customers who said they would continue to ride anyway. You’ll also want to take into account whether or not they agreed that the service provided sufficient standing room.
To begin, build a table with the variables you want to crosstabulate and request column percents:
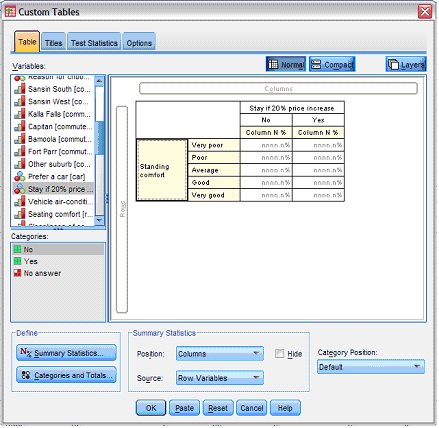
Figure 1: The basic crosstabulation
Then, click the Test Statistic tab.
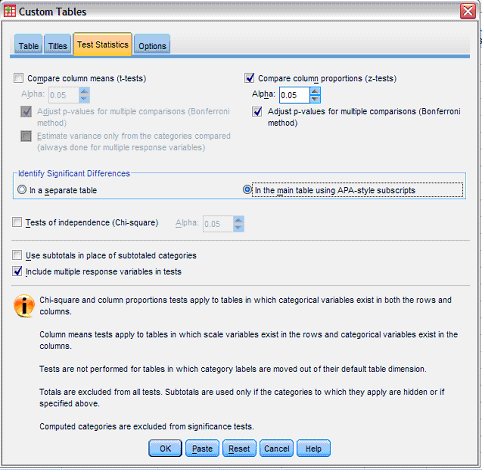
Figure 2: The Text Statistics tab
Click Compare column proportions (z tests), select In the main table using APA-style subscripts and click OK.
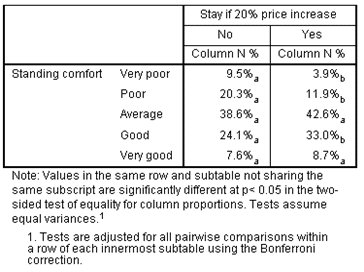
Figure 3: Results of comparisons of column proportions
Look across each row at the “Yes” and “No” percentages. If they have the same subscript (either “a” or “b”), it means that the values are not significantly different from each other. If they have different subscripts, the percentages are significantly different. For example, the 9.5% of the people who said they would stop riding if there were a 20% increase and also thought that standing room was very poor is significantly different from the 3.9% who said they would continue to ride anyway. However, the percentages in the “Average” column are not statistically different because each value has the same subscript.
*IBM SPSS Custom Tables was previously called PASW Custom Tables.
**IBM SPSS Statistics was previously called PASW Statistics.
We offer SPSS courses at locations around the world.
Find a course in the location nearest to you.
Predictive Analytics
can make your organization
more
successful
Resources


Worldwide Offices | Communications | Site Map | Contact Us | Terms and Conditions | Privacy Policy
© 2010 SPSS Inc., an IBM Company All rights reserved.
SPSS Inc., an IBM Company Headquarters, 233 S. Wacker Drive, 11th floor